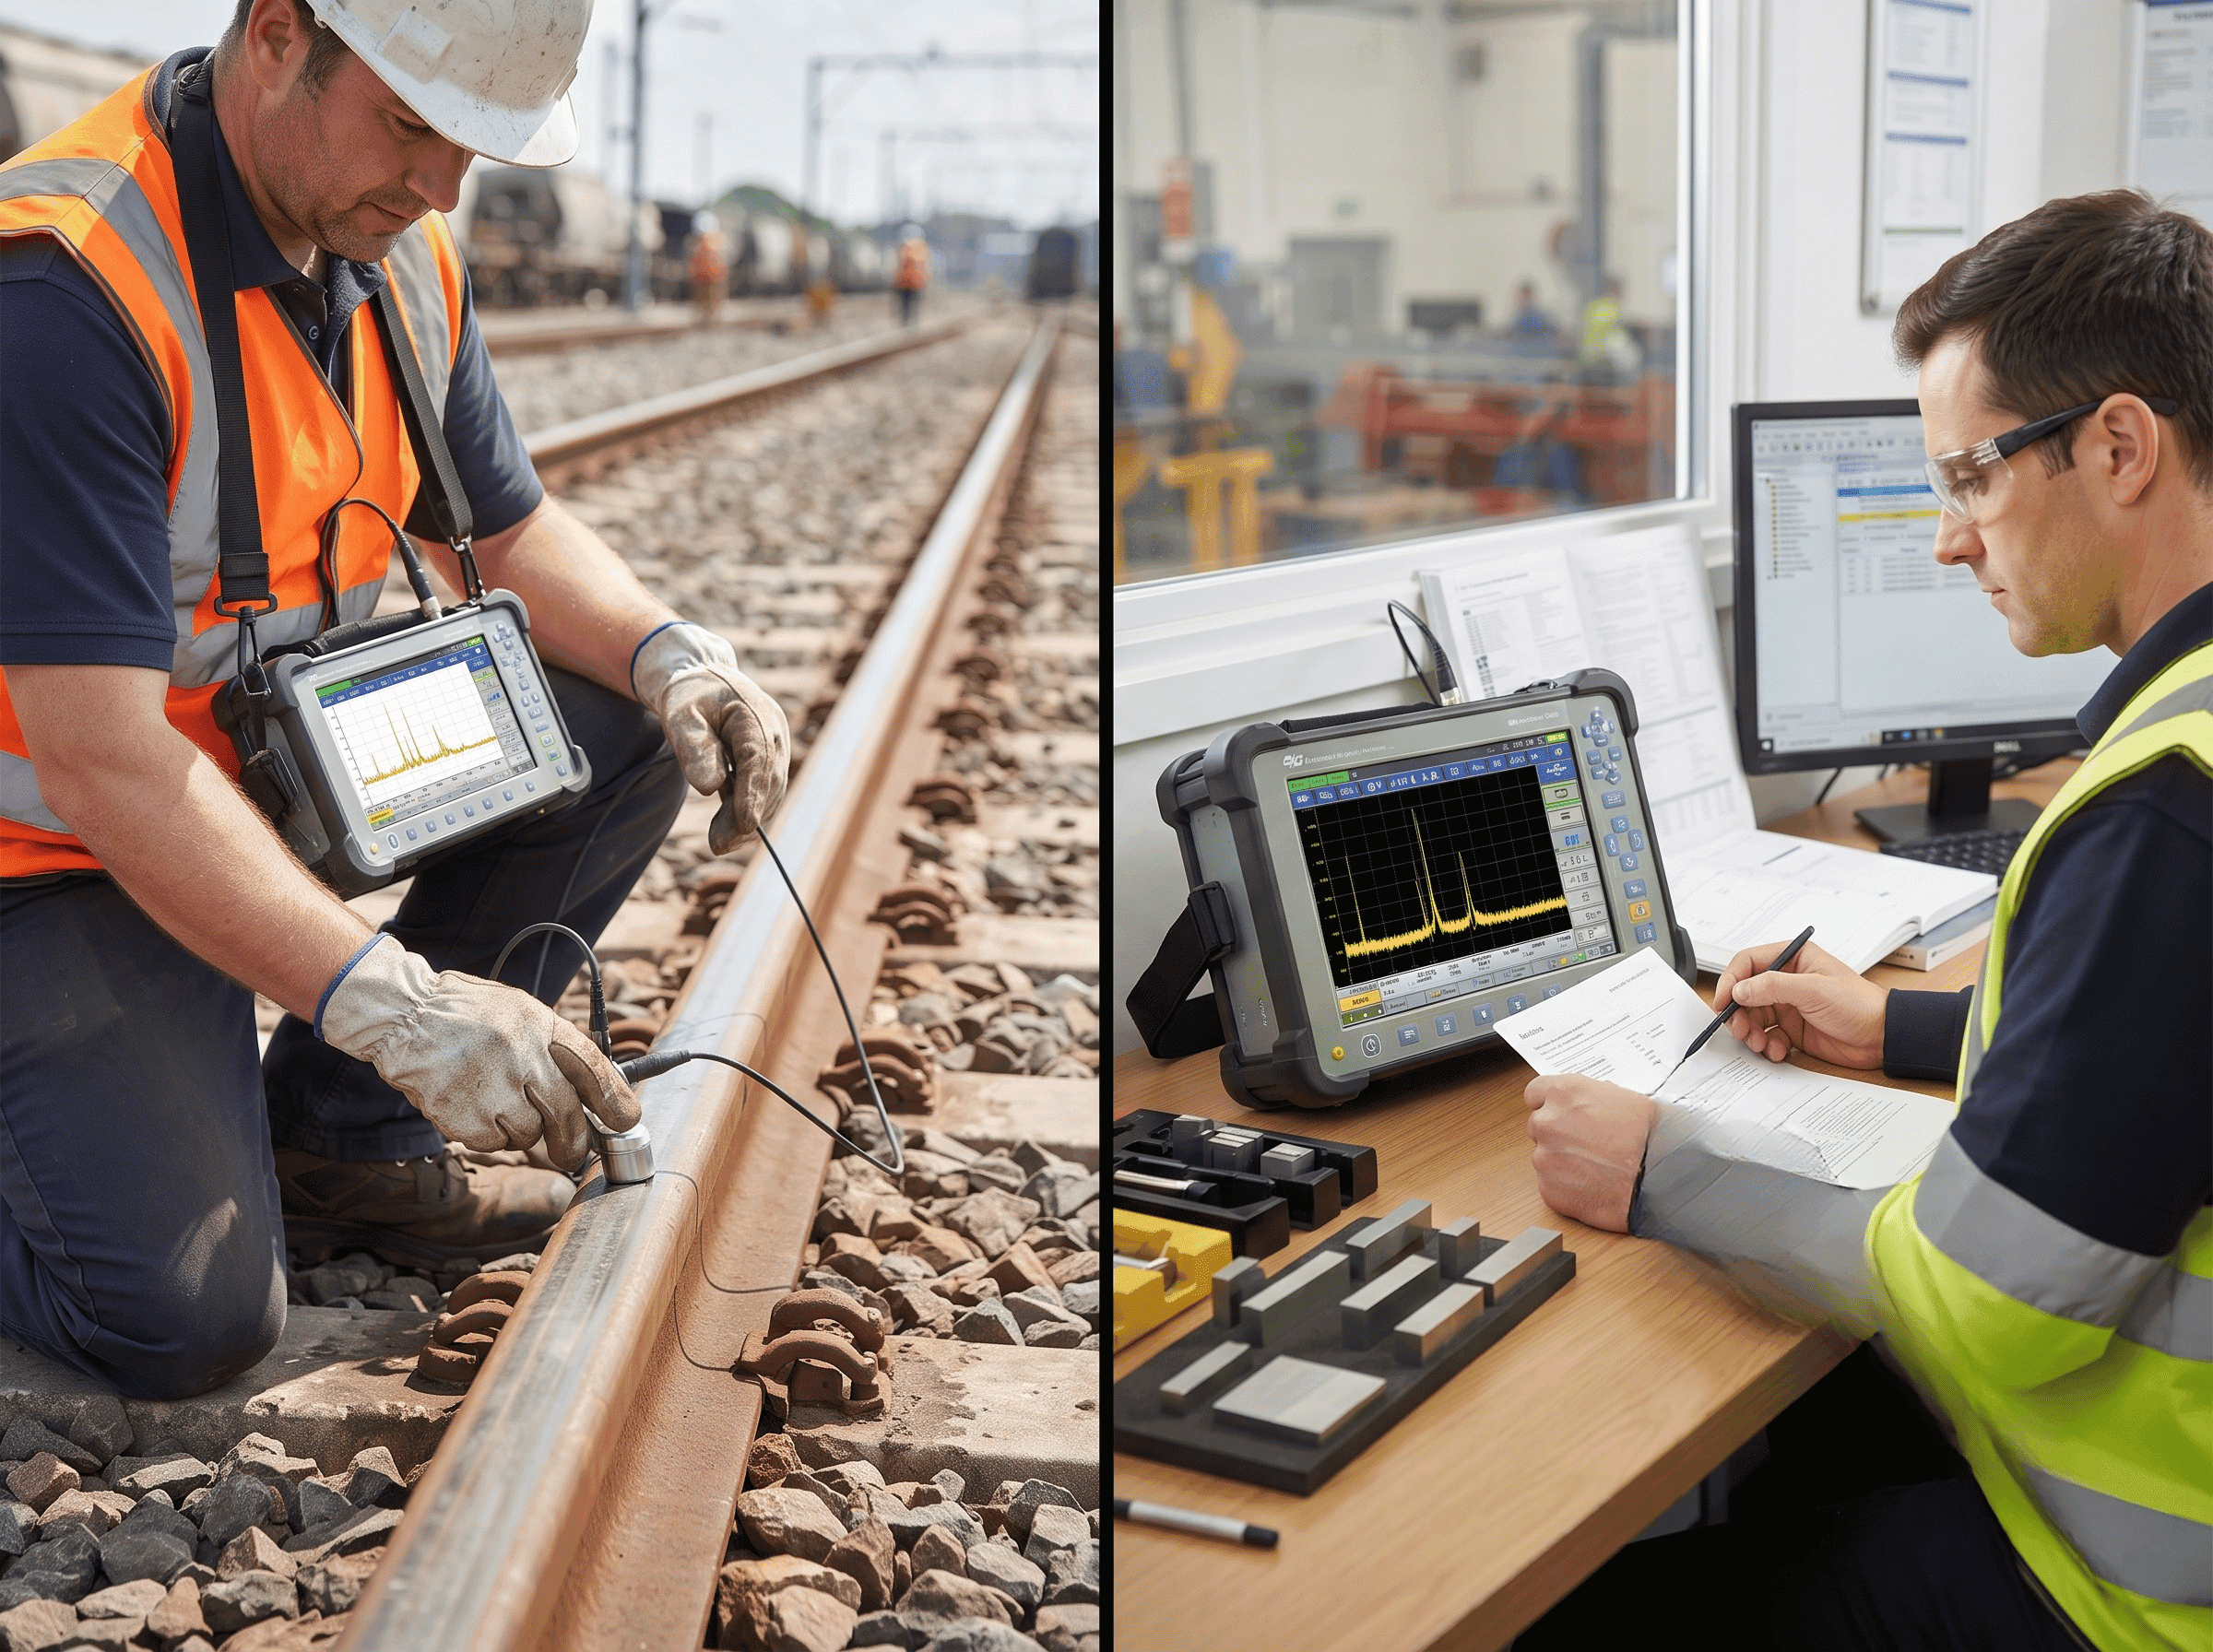
Learning how to read flaw detectors might seem daunting at first. But it's one of the most valuable skills a quality professional can develop. The stakes are real critical defects slip past unnoticed. Equipment fails. People get hurt. Understanding how to read flaw detector signals means the difference between catching problems early and facing catastrophic failures later.
What Is A Flaw Detector and How Does It Work?
A flaw detector is a non-destructive testing device that employs high-frequency sound waves to identify defects within solid materials without causing damage. Simple concept, really. Ultrasonic waves encounter a flaw. They bounce back. The instrument captures the echo. From that reflection, trained operators determine what exists inside the material.
The device generates ultrasonic pulses typically 0.5 to 25 MHz depending on application and material. These sound waves travel at predictable speeds through materials. Steel. Aluminum. Composites. Each conducts sound differently. When waves hit a boundary (defect, material interface, back wall), they reflect back to the transducer. The flaw detector displays these returning echoes. That's the core principle behind how to read flaw detectors effectively.
Industries everywhere depend on this technology. Aerospace. Automotive. Manufacturing. Construction. Welded joints in critical structures. Forged aircraft engine components. Pressure vessel walls. All require ultrasonic inspection. Alternative methods radiography, magnetic particle inspection, dye penetrant testing each have serious limitations for detecting internal defects that ultrasonic flaw detection catches.
Three primary flaw detector types exist today. Ultrasonic dominates. Eddy current systems handle surface defects in conductive materials. Radiographic equipment uses radiation. This guide focuses on ultrasonic technology since professionals serious about learning how to read flaw detector displays typically work with ultrasonic instruments in manufacturing and service environments.
Material velocity matters enormously. Steel conducts sound at approximately 5,900 meters per second. Aluminum at 6,420 meters per second. Composites vary wildly based on fiber orientation and resin type. Technicians who understand how to read flaw detectors must account for these material-specific velocities. Without them, depth calculations become meaningless.
So what happens next? Equipment sits ready. The operator's hand hovers over the transducer. Before anything meaningful occurs before anyone can reliably interpret signals or identify defects proper setup must happen first. That's where many inspectors stumble.
Why Proper Setup Is Essential Before Reading Flaw Detectors
Equipment preparation gets overlooked constantly. But it's the foundation everything else rests on. Improperly configured instruments produce garbage data. No skill can fix bad setup. The setup phase determines sensitivity. It determines resolution. It determines whether the operator can distinguish genuine defects from noise and artifacts.
Transducer connection comes first. Technicians must verify firm connections. The transducer needs to attach securely to the instrument's connector port. Cable attachments must be tight. Intermittent disconnections introduce electrical noise that masquerades as genuine defects. A loose connection ruins your ability to accurately learn how to read flaw detector displays. That noise creates false positives. Inspectors waste time investigating signals that don't exist.
Frequency selection depends on material type, expected defect size, and required detection depth. Higher frequencies 10 or 15 MHz provide excellent resolution for small defects. But they don't penetrate deeply. Lower frequencies 1, 2, or 5 MHz penetrate thick materials. You sacrifice resolution though. It's a tradeoff. Understanding these relationships proves essential for anyone serious about mastering how to read flaw detectors across varied applications.
Material considerations extend beyond simple frequency choices. Steel components require different transducer angles than aluminum. Couplant selection differs too. Acoustic impedance of each material affects ultrasonic propagation and reflection. Professionals who excel at how to read flaw detector signals account for these characteristics. They adjust their approach based on what they're inspecting.
And here's where it gets interesting. Setup complete. Equipment configured. The operator stands at a critical juncture. The display starts showing signals. But what do those signals actually mean? How does anyone distinguish genuine defects from system artifacts? The answer isn't intuition. It's calibration. Without it, every reading becomes suspect.
Calibration: The Foundation of Accurate How to Read Flaw Detector Results
Calibration transforms raw readings into meaningful measurements. Defect depth. Size. Location. Without proper calibration, attempts to learn how to read flaw detectors become fundamentally flawed. Calibration establishes the relationship between electrical signals and actual physical measurements. It's non-negotiable.
Three distinct procedures exist:
Zero Offset Calibration eliminates system delays. Ultrasonic pulses don't instantly enter test materials. They travel through the transducer. Through the cable. Through couplant. This delay called wedge delay for angled probes introduces systematic errors if left uncompensated. Zero offset calibration identifies this delay and eliminates it from all subsequent measurements.
Velocity Calibration establishes sound speed in the specific test material. Standard velocities exist. But actual values vary based on alloy composition, grain structure, temperature, and manufacturing history. By measuring transit time through a known-thickness calibration block, the flaw detector calculates actual velocity. This value then applies to all depth calculations throughout the inspection.
Reference Calibration establishes baseline signal amplitude. Operators place the transducer over a standard reflector flat-bottom hole or notch and adjust gain until the signal reaches predefined reference level. This enables defect sizing by comparing amplitudes to known references. It's the final piece of calibration setup.
The IIW reference block represents the industry standard. Aluminum or steel construction. Contains reflectors at precisely known depths (20mm, 40mm, 60mm). Multiple flat-bottom holes of various sizes. By calibrating against these standards, operators ensure their results prove traceable to recognized references. That traceability matters for compliance. For repeatability. For confidence.
Regular recalibration is essential. Environmental factors drift parameters. Temperature fluctuations. Humidity changes. Component aging. Professional standards ASME Section V, AWS D1.1 require calibration verification before work and periodically throughout inspection days. Those learning how to read flaw detectors must accept that calibration isn't a one-time event. It's ongoing. It's constant. It's quality assurance.
Essential Components You Must Recognize
Operators need familiarity with physical components that enable learning how to read flaw detectors. Each serves specific function. Each matters.
The Display Screen shows waveforms in real-time using liquid crystal technology. The A-scan format dominates field applications. Horizontal axis represents time converting to depth once calibration establishes material velocity. Vertical axis shows signal amplitude or voltage. The baseline runs horizontally at zero amplitude. Any upward extension represents energy returning from reflector or defect. Taller peaks mean stronger reflections. Horizontal position reveals reflector depth. That's how to read flaw detector displays effectively.
Control Buttons and Settings live on the instrument front panel. Multiple controls demand understanding when practicing how to read flaw detectors in real-world conditions. The gain knob adjusts signal amplification. Increase it, weak signals become visible. Decrease it, noise vanishes. Frequency controls select transducer frequency critical for matching probe to instrument settings. Gate or alarm controls establish threshold levels that trigger alerts when signals exceed specified amplitudes.
The Transducer or Probe converts electrical signals to ultrasonic waves and captures returning echoes. Straight beam transducers direct sound perpendicular to material surface ideal for thickness measurements and internal defect detection. Angle beam transducers position at 45 or 60 degrees enabling shear wave transmission useful for weld inspection. Understanding transducer selection represents foundational knowledge for learning how to read flaw detectors across different applications.
What Are the Factors to Consider for Ultrasonic Flaw Detector Use?
Material type determines frequency selection and expected sound velocity. Steel. Aluminum. Titanium. Composite materials. Each conducts ultrasound differently. Each attenuates differently.
Defect location expectations guide transducer selection. Surface defects versus weld defects versus internal voids demand different approaches. Required accuracy and sensitivity levels depend on industry standards and application criticality. Can you tolerate small defects? Must you catch everything? Environmental conditions temperature, humidity, accessibility constrain how inspectors position probes while learning how to read flaw detectors in challenging field conditions. Acoustic impedance affects energy transfer into test pieces and return to transducers. Thicker materials need lower frequencies for penetration. Thin sections benefit from higher frequency probes providing superior resolution.
A-Scan Displays: The Primary Format
The A-scan display dominates ultrasonic flaw detector operation because it presents data intuitively. Understanding A-scan interpretation is foundational for anyone serious about learning how to read flaw detectors accurately.
Three primary signal features convey essential information. The entry echo represents the initial signal when the transducer couples to material serves as reference point confirming acoustic contact. The back wall echo appears at distance corresponding to material thickness (assuming calibration is correct). Between these reference points? Unexpected signals indicate potential defects or anomalies requiring investigation.
Signal amplitude correlates with reflector size and surface characteristics. Large sharp-edged defects generate strong echoes creating tall peaks. Small inclusions produce weaker signals. Peak position reveals defect depth. Calibration ensures distance measurements prove accurate. And here's critical knowledge: experienced operators distinguish genuine defect signals from noise artifacts when they truly understand how to read flaw detectors. Electronic noise appears as small rapid baseline fluctuations. Genuine defects produce coherent organized peaks. Consistency matters more than absolute amplitude when distinguishing real indications from false signals.
That skill recognizing signal patterns, understanding what peaks mean, interpreting depth and size that's the heart of learning how to read flaw detector data. It comes from practice. From exposure to reference standards containing known flaws. From repetition with varied materials and equipment configurations. Training sessions with calibrated reference blocks accelerate learning and build confidence.
The journey from novice to expert inspector follows a predictable path. Master the components. Understand calibration. Learn signal recognition. Practice with known standards. Then apply that knowledge to real inspections. That's when operators truly grasp how to read flaw detectors professionally.
B-Scan Displays and Advanced Interpretation
B-scan changes everything. Where A-scan shows what happened at one single location, B-scan reveals the full picture across an entire scanned path. This two-dimensional visualization transforms how to read flaw detector signals from a line-by-line analysis into a comprehensive material map.
Think of B-scan this way: the horizontal axis runs along your material surface as you move the transducer. The vertical axis shows depth. Every point on screen gets a brightness value representing echo strength. Dark spots mean weak signals. Bright spots mean strong reflections. That's how to read flaw detector B-scan images in basic terms.
The back wall echo appears as a horizontal line running across the display. Clean, uninterrupted. Anything above it doesn't belong. It's a defect. And the pattern tells you what kind.
Why B-scan beats A-scan for complex geometries matters more than most operators realize. Laminar flaws those flat defects sitting parallel to your surface show up instantly as horizontal lines on B-scan. Cracks oriented perpendicular create vertical or angled marks. This visual pattern recognition speeds up inspection dramatically. You see the flaw before calculating anything.
But here's the catch: interpreting B-scan requires understanding how to read flaw detector displays across the full image. A single bright spot might be noise. Multiple organized spots following a line pattern? That's a defect. Learning how to read flaw detector cross-sectional data means developing this visual intuition alongside technical knowledge.
Weld inspection benefits most from B-scan capability. Technicians scan perpendicular to the weld line, capturing the entire cross-section. Lack of fusion appears as continuous lines. Cracks show distinctive patterns. Porosity creates scattered indications. And when you understand how to read flaw detector B-scan images properly, you eliminate ambiguity that plagues A-scan-only inspections.
Now here's what separates competent operators from experts: can you recognize defect patterns instantly? That skill determines whether inspections take hours or minutes.
Common Defects and Their Signatures When Learning How to Read Flaw Detectors
Every defect type leaves a fingerprint. Sharp, defined peaks mean cracks. Multiple scattered indications suggest porosity. Smooth, organized lines indicate lack of fusion. Understanding how to read flaw detector signals means memorizing these patterns until recognition becomes automatic.
Cracks produce the sharpest peaks on A-scan displays. They're clean. Organized. The amplitude depends on crack orientation perpendicular cracks scream back at the transducer. Parallel cracks whisper. On B-scan, cracks appear as continuous lines matching their actual tilt in the material. Want to confirm a crack? Scan from multiple angles. The indications move position and amplitude as you change approach. That's your proof.
Voids and porosity look nothing like cracks. Multiple small peaks scattered randomly across the display. Each one represents a separate void. How to read flaw detector signals from porosity requires recognizing this characteristic clutter. It's not one indication. It's dozens. The B-scan image shows numerous disconnected bright spots rather than the crisp lines you'd see with cracks.
Lack of fusion creates moderate-amplitude peaks appearing relatively close to surface. The boundary between weld metal and base metal produces this echo. How to read flaw detector indications from fusion defects means understanding that you're detecting a planar surface, not a sharp crack or scattered void. The signal appears cleaner than porosity but differently shaped than cracks. It's intermediate. Specific. Recognizable once you've seen a few.
Inclusions vary wildly depending on size and type. Tungsten? Creates strong sharp peaks. Slag? Sometimes weak, sometimes strong. This unpredictability challenges operators learning how to read flaw detector signals from inclusions. You can't rely on amplitude alone. Context matters. Location matters. Material composition around the inclusion matters.
But there's a pattern even here. Inclusions create localized, individual indications. Single peaks or clusters at specific depths. Not scattered randomly like porosity. Not continuous like cracks. When you understand how to read flaw detector displays with this level of discrimination, defect characterization becomes straightforward.
Practical Step-by-Step Reading Procedure
Systematic work prevents mistakes. Inspection procedures exist because competent professionals learned through hard experience what actually works.
Before touching the material, verify everything. Check connections. Battery status. Cable integrity. No damage visible? Good. Now clean your scanning surface aggressively. Rust blocks ultrasound. Paint blocks ultrasound. Dirt? Same problem. Get down to bare metal or the coating specified for your application. Select appropriate couplant. Temperature matters choose formulations rated for your environment. Then run calibration. Always. Every single inspection starts with reference block verification.
During actual scanning you're moving the transducer deliberately across the component surface. Linear paths work for flat parts. Rectangular grids suit complex geometries. The pace matters too fast and you miss indications. Too slow and unnecessary time burns. How to read flaw detector signals effectively means maintaining consistent probe contact while moving methodically. Note every suspicious indication. Record its position. Estimate amplitude compared to calibration reference. Calculate depth from time-of-flight measurements. Document everything in real-time because memory fails when you're focused on scanning mechanics.
After scanning the real work starts. Compare indications against applicable standards. ASME Section V requirements differ from AWS D1.1. Engineering specifications might be stricter still. Indications that exceed limits demand characterization multiple scan angles determine crack orientation. Different frequencies help differentiate defect types. Detailed measurements establish precise location and size. And when you're finished, comprehensive documentation supports quality assurance and traceability.
Learning how to read flaw detector results means understanding that post-inspection analysis determines value. Data collection is meaningless without proper interpretation.
What Is the Principle Behind Flaw Detection by Ultrasonic?
Physics explains why how to read flaw detector signals works. Sound waves are mechanical vibrations. They travel through material at predictable speeds. When waves hit an interface between different materials different acoustic impedance reflection happens.
Acoustic impedance is the product of density and sound velocity. Steel has high impedance. Air has low impedance. A crack filled with air creates massive impedance contrast. That means strong reflection. That means strong signal. Operators learning how to read flaw detector displays benefit from understanding this fundamental relationship.
Defects create boundaries. Solid cracks create air-material boundaries. Voids create air-material boundaries. Each generates echoes. How to read flaw detector signals becomes logical once you understand you're essentially mapping acoustic impedance changes throughout your material.
Frequency determines minimum detectable flaw size roughly half the wavelength. Higher frequencies equal shorter wavelengths equal detection of tiny defects. But attenuation increases with frequency. Deep penetration requires lower frequencies. This tradeoff drives how to read flaw detector setup decisions in real applications. You balance sensitivity against depth requirements. That's not guesswork. That's physics.
Troubleshooting When You Can't Read Flaw Detector Signals
No signal or weak signal. First check: is your transducer connected properly? Connections fail. Cables break. Frequency settings might be wrong. Transducer frequency must match your material and application. Test on a known good reference standard immediately. If the reference standard shows good signals, your equipment works. The problem is probably environmental poor surface contact, inadequate couplant, temperature issues.
False indications plague operators learning how to read flaw detector results. Noise sometimes mimics defects. Repeat measurements at different angles. Genuine defects show consistent indications regardless of probe angle. Noise and artifacts disappear or shift. That's your discrimination tool.
Inconsistent readings across multiple scans suggest equipment drift. Calibration verification becomes mandatory. Temperature fluctuations affect velocity calculations. Environmental humidity affects acoustic coupling. These factors compound over time. Regular recalibration prevents systematic errors from creeping into your measurements and corrupting how to read flaw detector interpretations.
Equipment Maintenance Keeps Your Capability Consistent
Inspect your equipment regularly. Cables fray. Connectors corrode. Transducers wear. Visual inspection catches problems early. Battery maintenance matters fully charge before use, store properly during downtime. Transducer care includes gentle handling and protective storage cases. Professional calibration verification according to ASTM E-317 ensures ongoing accuracy. This isn't optional work. This is what separates reliable inspections from problematic ones.
Industry Standards Define What Actually Matters
ASME Section V establishes requirements for pressure vessel inspection. AWS D1.1 governs weld inspection. ASTM E-317 covers calibration certification. These standards define acceptance limits. They specify equipment capabilities. They establish procedures. Learning how to read flaw detector data means understanding your applicable standard. Different industries accept different defect sizes at different locations. What fails in aerospace might pass in manufacturing. What passes in pressure vessels might fail in bridge construction.
Final Thoughts
Competence emerges through combining theoretical knowledge with extensive practical experience. Understanding how to read flaw detector signals requires time. Practice. Exposure to varied materials and equipment. Those serious about excellence pursue certified training programs. They stay current with evolving standards. They practice regularly on reference standards.
The ability to accurately interpret inspection results protects critical infrastructure. Prevents costly failures. Demonstrates genuine commitment to quality that employers value. And that's what learning how to read flaw detectors really delivers not just technical competency, but professional credibility backed by tangible, measurable skill.
Key Takeaways
- Calibration forms the foundation for all accurate flaw detector signal interpretation.
- A-scan displays show signal amplitude versus time for defect depth measurement.
- Material velocity calibration ensures accurate depth calculations for all inspected components.
- Transducer selection depends on material type, frequency requirements, and defect location.
- B-scan imaging provides two-dimensional views revealing flaw location and orientation details.
- Defect pattern recognition improves through practice using reference standards containing flaws.
- Entry and back wall echoes serve as reference points for location.
- Signal amplitude correlates with reflector size and material surface characteristics directly.
- Systematic scanning procedures ensure consistent, reliable, and comprehensive flaw detection results.
- Industry standards like ASME Section V and AWS D1.1 guide interpretation.
FAQs
What Are the Factors to Consider for the Ultrasonic Flaw Detector?
Material type, frequency selection, acoustic impedance, defect location, accuracy levels, sensitivity requirements, environmental conditions, transducer selection and surface accessibility determine optimal configuration.
How Do You Detect Flaws in Metals?
High-frequency ultrasonic waves transmit through metals and reflect when encountering defects. Operators analyze returned echoes to locate, identify and characterize detected flaws.
What Is the Principle Behind Flaw Detection by Ultrasonic?
Ultrasonic waves reflect at acoustic impedance boundaries created by defects. Cracks, voids and inclusions generate distinctive echo signals revealing flaw location details.
How Do You Interpret A-Scan Displays on Flaw Detectors?
A-scan displays show signal amplitude versus time. Entry and back wall echoes serve as references. Unexpected signal peaks indicate potential material defects.