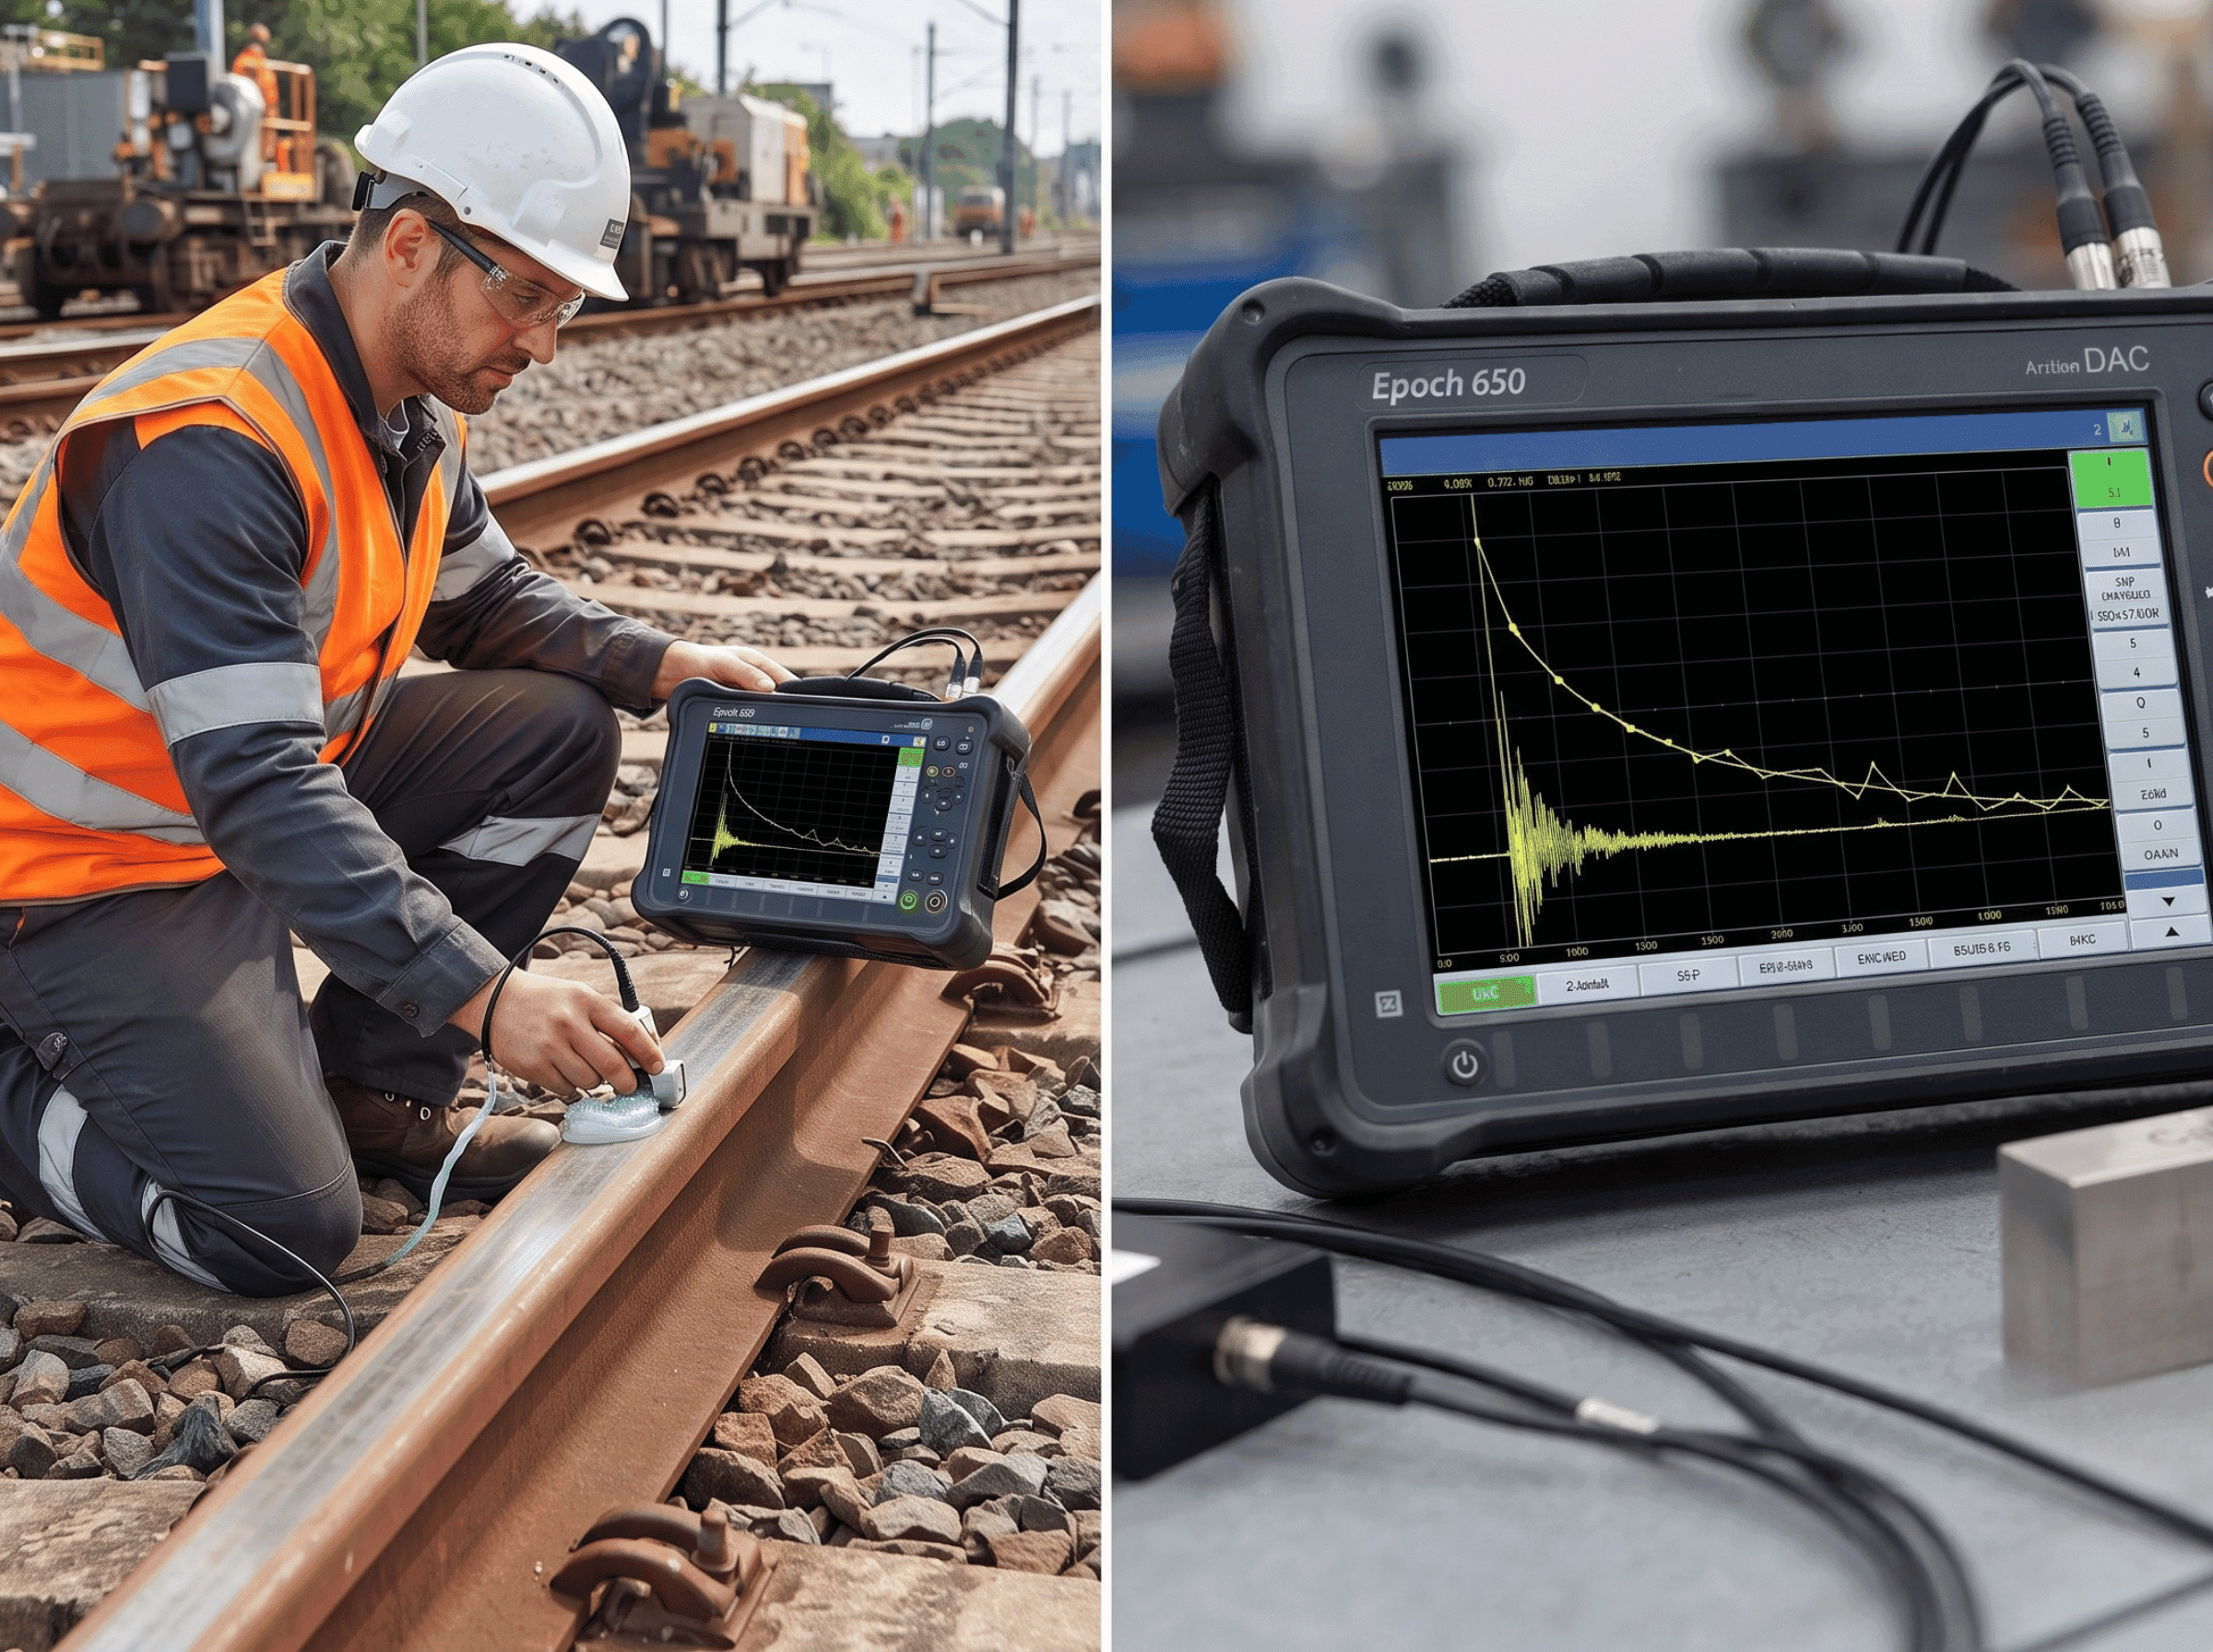
A DAC curve (distance amplitude correction curve) is a reference line joining the peak echoes of identical reflectors at increasing sound paths, all recorded at one fixed gain. In ASME Section V Article 4 practice, the highest response is set to 80% of full screen height, and every indication is then judged as a percentage of, or dB from, that curve.
This guide covers how to build the curve, a full ASME-style worked example with the 50% and 20% DAC levels and a transfer correction, the near-field rule, and how DAC compares with TCG, DGS/AVG and the AWS D1.1 rating. The sound-path geometry (leg, skip, surface distance) is in our guide to angle beam testing in UT.
Contents: What DAC corrects · Blocks · Step by step · Worked example · Near field · 50% and 20% DAC · DAC vs TCG · DGS/AVG · AWS D1.1 · Rail · Mistakes · Limits · FAQ
What does a DAC curve correct for?
A DAC curve corrects for the fall in echo height with distance, so that an indication at any depth is compared with the response of a known reflector at that same sound path. Echo height drops with distance for three reasons: beam spread, material attenuation (absorption and grain scattering) and, close to the probe, near-field interference.
Evident's flaw detection tutorial puts it in one line:
A DAC curve "graphically compensates for material attenuation, nearfield effects, and beam spreading." (Evident, DAC and TVG tutorial)
The curve does not measure flaw size; it compares a reflector with a reference hole at the same distance. Length and height come from sizing techniques such as the 6 dB drop, covered in our UT formulas guide.
The decibel arithmetic behind DAC
Every DAC level is a decibel ratio. Gain works on amplitude (screen height), so dB = 20 log₁₀(A₁/A₂). Energy is proportional to amplitude squared, so for energy dB = 10 log₁₀(I₁/I₂).
| Change | Amplitude ratio | dB |
|---|---|---|
| Amplitude halves (for example 80% to 40% FSH) | 0.5 | −6.02 dB |
| Energy halves (amplitude falls to 70.7%) | 0.707 | −3.01 dB |
| 50% DAC level | 0.5 | −6.02 dB |
| 20% DAC level | 0.2 | −13.98 dB |
| Amplitude doubles (+6 dB scanning gain) | 2.0 | +6.02 dB |
A 6 dB loss halves the amplitude, not the energy; halving the energy is a 3 dB loss. It matters here because the 50% DAC line is 6 dB below the reference curve.
Key takeaway: a DAC curve converts "how high is the echo?" into "how strong is this reflector compared with the reference at this distance?"
Which reference blocks and reflectors does a DAC curve need?
A DAC curve needs at least three identical reflectors at different sound paths, in a block of acoustically similar material and finish, peaked with the same probe, angle and scanning surface used on the part. For angle-beam weld work under ASME Section V Article 4, that block is normally the basic calibration block with side-drilled holes (SDHs).
The ASME basic calibration block (Article 4, T-434.2.1) has three SDHs at 1/4 T, 1/2 T and 3/4 T. Vendors who make blocks to that figure list these hole sizes:
| Block thickness (vendor listings) | SDH diameter | Hole positions |
|---|---|---|
| 1/2 in. and 3/4 in. | 3/32 in. | 1/4 T, 1/2 T, 3/4 T |
| 1-1/2 in. | 1/8 in. | 1/4 T, 1/2 T, 3/4 T, holes drilled at least 1.5 in. deep |
| 3 in. | 3/16 in. | 1/4 T, 1/2 T, 3/4 T |
| 5 in. | 1/4 in. | 1/4 T, 1/2 T, 3/4 T |
Figure T-434.2.1 ties the block thickness to the weld thickness range. These values come from block makers' catalog pages, so check the figure in the edition your contract names before ordering or qualifying a block.
Why side-drilled holes for angle beams: an SDH is a cylinder, so it returns the same echo whatever the beam angle, and it has no orientation to get wrong. Flat-bottom holes (FBHs) are the usual reflector for straight-beam work and are the basis of DGS. Notches are used for piping blocks and for surface-breaking reflectors.
Key takeaway: the reflectors must be identical in size and type; only their distance from the probe should change.
How do you build a DAC curve step by step?
Calibrate the range and angle first, find the reference reflector with the highest response, set it to 80% FSH, then freeze the gain and mark the peak of every other reflector without touching the gain again. The steps below follow common ASME Article 4 practice; your written procedure governs.
- Verify the probe. Check the beam index point, refracted angle and range on an IIW-type block, or the points land at the wrong sound paths.
- Choose the block. Use the basic calibration block for the thickness range, in material similar to the part.
- Work out the near field. Calculate the near-field length for the probe (or take it from the data sheet) and decide which reflectors are beyond it. Points inside it are not plotted (see the near-field section below).
- Peak every usable reflector once, to find the highest. It is usually, but not always, the shortest usable sound path.
- Set the highest response to 80% FSH. This is the primary reference level. Record the gain.
- Freeze the gain. From this point the gain and every other setting that affects amplitude stay fixed.
- Peak and mark each remaining reflector at its true maximum, at the height it shows. Don't adjust any echo to 80%.
- Use both legs for angle beams, so the curve covers every sound path used in the weld.
- Join the points. Most digital instruments join the marks with straight segments. The curve is valid only between the first and last measured points.
- Add the evaluation curves. Most procedures display 50% DAC (−6 dB) and 20% DAC (−14 dB) lines below the reference curve.
- Record and confirm. Record the instrument, probe, wedge, block, cable, couplant, gain and points, then recheck a point at the procedure's intervals and whenever the probe, cable, couplant or operator changes.
Key takeaway: only one echo is set to a fixed height. Every other point is recorded exactly as it appears at the frozen gain.
Worked example: how is a multi-point ASME DAC curve built and used?
Example inputs: a 1-1/2 in. (38 mm) carbon steel butt weld, examined with a 45° shear-wave probe, 5 MHz, 0.25 in. (6.35 mm) element. The basic calibration block is 1.500 in. thick with three 1/8 in. SDHs at 1/4 T, 1/2 T and 3/4 T. All inputs are illustrative; the amplitudes are example readings, not measured data.
Our angle beam testing guide lists the six sound paths for a 60° probe on a 1 in. block. This example goes further: near-field exclusion, dB values, the 50% and 20% levels, transfer correction and an evaluated indication.
Step 1: sound paths to each hole
For a 45° beam, cos 45° = sin 45° = 0.7071. One leg in a 1.500 in. block is 1.500 ÷ 0.7071 = 2.121 in. of sound path, and the full skip is 2 × 1.500 × tan 45° = 3.000 in. on the surface.
| Hole | Depth | Leg | Sound path | Surface distance |
|---|---|---|---|---|
| 1/4 T | 0.375 in. | First | 0.375 ÷ 0.7071 = 0.530 in. | 0.375 in. |
| 1/2 T | 0.750 in. | First | 0.750 ÷ 0.7071 = 1.061 in. | 0.750 in. |
| 3/4 T | 1.125 in. | First | 1.125 ÷ 0.7071 = 1.591 in. | 1.125 in. |
| 3/4 T, from below | 1.125 in. | Second | (3.000 − 1.125) ÷ 0.7071 = 2.652 in. | 1.875 in. |
| 1/2 T, from below | 0.750 in. | Second | (3.000 − 0.750) ÷ 0.7071 = 3.182 in. | 2.250 in. |
| 1/4 T, from below | 0.375 in. | Second | (3.000 − 0.375) ÷ 0.7071 = 3.712 in. | 2.625 in. |
On the second leg, sound path = (2T − depth) ÷ cos θ. All depths are inside the 1.500 in. block.
Step 2: drop the point that falls in the near field
The near-field length is N = D²f ÷ 4v. With D = 0.25 in., f = 5 MHz and a shear velocity in steel of about 0.1280 in./µs (3,250 m/s):
N = (0.25² × 5) ÷ (4 × 0.1280) = 0.3125 ÷ 0.512 = 0.61 in. of sound path
This ignores the part of the near field used up inside the wedge, so the true in-steel value is shorter. Taking 0.61 in. is the conservative choice. The first-leg 1/4 T hole at 0.530 in. falls inside it, so it is not plotted. The other five points are all beyond 0.61 in.
The shallow weld zone isn't lost. The second-leg 1/4 T point at 3.712 in. covers the top quarter of the weld from below, so the curve still spans 1.061 to 3.712 in.
Step 3: set the reference and record the curve
The 1/2 T first-leg hole gives the highest response, so it is set to 80% FSH. The gain needed is 38.0 dB (example value). With the gain frozen at 38.0 dB, the other holes read:
| DAC point | Sound path | Peak (% FSH) | dB below reference | 50% DAC line | 20% DAC line |
|---|---|---|---|---|---|
| 1 (1/2 T, first leg) | 1.061 in. | 80% (set) | 0.00 | 40.0% | 16.0% |
| 2 (3/4 T, first leg) | 1.591 in. | 64% | 1.94 | 32.0% | 12.8% |
| 3 (3/4 T, second leg) | 2.652 in. | 45% | 5.00 | 22.5% | 9.0% |
| 4 (1/2 T, second leg) | 3.182 in. | 37% | 6.70 | 18.5% | 7.4% |
| 5 (1/4 T, second leg) | 3.712 in. | 30% | 8.52 | 15.0% | 6.0% |
Each "dB below reference" value is 20 log₁₀(80 ÷ peak). The 50% line is the DAC height × 0.5 (−6.02 dB) and the 20% line is × 0.2 (−13.98 dB). At the far end of the range the 20% line is only 6% FSH, close to the noise on many parts, which is one reason long sound paths are better handled with TCG.
Step 4: measure the transfer correction
The block is machined; the part is mill-scaled plate. Two identical 45° probes in pitch-catch are set to 80% FSH on the block at a fixed separation, then the same separation is measured on the part. In this example the pitch-catch signal needs 30.0 dB on the block and 34.0 dB on the part, so the transfer correction is +4.0 dB.
| Setting | Gain |
|---|---|
| Primary reference level on the block | 38.0 dB |
| Transfer correction | +4.0 dB |
| Reference level for evaluation on the part | 42.0 dB |
| Scanning gain, at least 2× (+6 dB) the reference | 48.0 dB or more |
Only add a transfer correction when the procedure calls for one and says how to measure it. If the block is a cut-off of the part, or the procedure is silent, don't invent a number.
Step 5: evaluate an indication
While scanning at 48.0 dB, an echo appears at a sound path of 2.40 in. The inspector returns to the 42.0 dB reference level, peaks the echo, and reads 30% FSH.
- Location: 2.40 in. is beyond one leg (2.121 in.), so it is on the second leg. Depth = 2 × 1.500 − 2.40 × 0.7071 = 1.303 in.; surface distance = 2.40 × 0.7071 = 1.697 in. from the beam index point.
- DAC height at 2.40 in.: between point 2 (1.591 in., 64%) and point 3 (2.652 in., 45%), the straight-line DAC height is 64 + (45 − 64) × (2.40 − 1.591) ÷ (2.652 − 1.591) = 49.5% FSH.
- Amplitude relative to DAC: 30 ÷ 49.5 = 60.6% DAC, or 20 log₁₀(30 ÷ 49.5) = −4.35 dB from the reference curve.
The indication is above the 50% and 20% lines and below the reference curve. At 48.0 dB scanning gain it read about 60% FSH, which is why evaluation is done at reference gain.
What happens next depends on the referencing code, not on Article 4. Under ASME Section VIII Division 1 Appendix 12, as reported by secondary sources, any indication over 20% of reference is investigated. Cracks, lack of fusion and incomplete penetration reject at any length; other indications reject only if they exceed the reference level and a length limit (t/3 for this 1-1/2 in. weld, which is 0.50 in.). This 60.6% DAC indication must be characterized. If it is not a crack, lack of fusion or incomplete penetration, it is below the reference level and does not reject.
Key takeaway: report an indication as "% DAC" or "dB to DAC" at its own sound path, at reference gain plus any transfer correction.
Why must DAC points stay out of the near field?
Echo amplitude inside the near field swings up and down with small changes in distance and probe position, so a point plotted there does not represent the curve and can't be used to judge reflectors at nearby depths. The near field is the zone in front of the probe where waves from different parts of the element interfere, and it ends at the natural focus, N = D²f ÷ 4v.
Evident's beam tutorial notes that amplitude-based evaluation is difficult in the near field. In practice:
- Calculate N for every probe used to build a DAC. Larger, higher-frequency probes have longer near fields: a 0.5 in., 2.25 MHz element in steel shear gives about 1.10 in., almost twice the 0.61 in. of the probe in the worked example.
- Don't set the 80% reference on a near-field reflector. The highest response in the near field may not be the highest response of the curve, and a reference set there shifts every other point.
- Cover shallow zones another way: the second leg, a smaller or lower-frequency probe, or a dual-element probe.
Our guide to near field vs far field in UT explains the physics and the near-field formula in more detail.
Key takeaway: a DAC point is only valid beyond the near field of the probe that measured it.
What are the 50% and 20% DAC levels for?
The 20% DAC line is an investigation threshold and the 50% DAC line is a common recording threshold; neither is an acceptance limit on its own. Acceptance comes from the construction code that references Section V.
| Level | dB from reference | Typical use | Where it comes from |
|---|---|---|---|
| 100% DAC (reference curve) | 0 dB | Amplitude limit for "other" indications in ASME VIII App. 12 and B31.3 UT acceptance | Referencing code, with a length limit |
| 50% DAC | −6.02 dB | Recording level in many procedures; Section XI weld examination records reflectors over 50% of reference (IWA-2232, as quoted by NRC) | Referencing code or procedure |
| 20% DAC | −13.98 dB | Indications above it are investigated to decide their nature, then judged against the acceptance criteria | ASME VIII App. 12 and Article 4-based procedures |
ASME Section V is a method document and contains no acceptance criteria. Our guide to ultrasonic testing acceptance criteria standards separates the examination standard from the acceptance standard for ASME, AWS and API work.
Key takeaway: write the recording and evaluation levels into the procedure from the referencing code; don't assume them from the DAC screen.
DAC vs TCG: which should you use?
Use DAC when the procedure wants a visible curve and the range is modest; use TCG (time-corrected gain) when long sound paths push the far end of the DAC toward the noise. Both come from the same reflectors.
TCG raises the gain with sound path so each reference hole peaks at the same height, usually 80% FSH, turning the DAC into a flat line. Evident calls it TVG (time-varied gain).
| Item | DAC | TCG / TVG |
|---|---|---|
| Gain | Fixed | Increases with sound path |
| Reference on screen | A falling curve | A horizontal line, usually at 80% FSH |
| Far-end screen height | Can be very low (6% FSH for 20% DAC in the example) | Stays readable at every depth |
| Evaluation | % DAC or dB to the curve | % of the line or dB to the line |
| Noise | Noise stays at a constant gain | Noise rises with the added gain at long paths |
| Best fit | Short to medium ranges, manual A-scan work | Long ranges, thick sections, encoded or PAUT work |
Don't mix the two languages. A "−6 dB" evaluation line on a TCG screen is 6 dB below the flat reference line, not below a DAC curve.
Key takeaway: DAC and TCG are the same calibration displayed two ways; the procedure decides which one is used.
When is DGS/AVG used instead of a DAC curve?
DGS (distance-gain-size, called AVG in German) is used when a calculated curve set and an equivalent reflector size are wanted instead of a measured curve, most often in European and ISO practice and in straight-beam work on forgings and plate. It needs only one calibration echo, such as a back wall, instead of a block with holes at every depth.
Evident describes DGS as a technique that "relates the amplitude of the echo from a reflector" to a flat-bottom hole at the same distance. The instrument draws the curves from the probe's frequency and element size, and reports an equivalent reflector size (ERS), the diameter of an FBH that would give the same echo.
| Item | DAC | DGS/AVG |
|---|---|---|
| Curve source | Measured on reference reflectors | Calculated from probe data, from one reference echo |
| Block needed | A block with reflectors over the full range | One reference (back wall or FBH); attenuation entered or measured |
| Result | % DAC or dB to the reference | Equivalent reflector size (ERS) as an FBH diameter |
| Probe | Any probe, once measured | Probe must be characterized for DGS (curves for that probe) |
| Typical codes | ASME Section V Article 4 procedures | ISO 16811 (sensitivity and range setting) covers both; ISO 17640 weld testing lists DGS as one technique (secondary sources) |
DGS is a mathematical model, and Evident warns that the user must decide how its results relate to real flaws. An ERS of 2 mm does not mean a 2 mm flaw.
Key takeaway: DGS replaces the measured curve with a calculated one; it is not a better DAC, and it still needs the procedure's approval.
Does AWS D1.1 use a DAC curve?
AWS D1.1 does not use a DAC curve for its standard ultrasonic acceptance; it rates each indication against a single side-drilled hole with the formula d = a − b − c, then compares d with D1.1's own acceptance tables. Treating D1.1 as a "DAC code" is a common error.
Evident's AWS tutorial gives the terms: A is the discontinuity indication level in dB, B the reference indication level in dB (from the 0.060 in., 1.5 mm SDH in the IIW-type block), and C the attenuation factor, "2x [soundpath length in inches – 1 in.]" in dB. D, the indication rating, can be positive or negative.
A short D1.1 contrast example
A 70° probe on 1 in. plate, with a reference level b of 46 dB. An indication at a 2.50 in. sound path (first leg, depth 2.50 × cos 70° = 0.86 in.) needs a = 48 dB to reach the reference line height.
- c = 2 × (2.50 − 1) = 3.0 dB
- d = 48 − 46 − 3.0 = −1
A lower (more negative) d is a stronger reflector. The class depends on weld thickness, probe angle and static or cyclic loading. In the older static table reproduced on the AWS forum, a 70° rating of +2 or lower on welds over 3/4 in. to 1-1/2 in. is Class A (reject), but that band must be confirmed against the edition in the contract (D1.1/D1.1M:2025 is current). Two other points: D1.1 itself does not require UT (the contract or a building code such as AISC 360 does), and the 2 dB/in. attenuation factor is an approximation that can be several dB off at long sound paths.
Our guide to AWS D1.1 weld inspection criteria covers the D1.1 tables, and ASME weld ultrasonic inspection covers the ASME route.
Key takeaway: in D1.1 work, report d ratings, not % DAC, unless the contract invokes an alternative procedure.
Does FRA Part 213 require a DAC curve for rail testing?
No. 49 CFR Part 213 never mentions DAC, decibels or ultrasonic calibration; it sets performance rules for internal rail inspection and leaves the equipment set-up to the track owner and test provider. A full-text search of the 2025 Part 213 finds no use of "ultrasonic", "decibel" or "distance amplitude"; "calibration" appears only for gage restraint measurement vehicles.
What the rule requires is a valid search. Under 49 CFR 213.237, a valid search is a continuous inspection "where the equipment performs as intended and equipment responses are interpreted by a qualified operator," and the operator must be qualified under 213.238.
FRA's own research confirms the gap. FRA report DOT/FRA/ORD-26/07 (ENSCO, July 2026) found that North American railroads have no standardized calibration procedure for handheld rail UT. Typical practice is zero, velocity, angle, and gain set to 80% FSH on a known flaw, usually on an IIW Type 2 block. The same study found that operators' calibration results rarely matched each other, and warns that "calibration errors can cause excessive false positives and false negatives."
A DAC can still be useful for hand-verifying suspect calls or testing rail welds, if the procedure defines the block and levels. Our page on ultrasonic testing calibration for rail inspection RFPs lists what to ask a provider to document.
Key takeaway: in rail work, DAC is a procedure choice, not an FRA requirement.
What mistakes make a DAC curve wrong?
Most bad DAC curves come from changing something between points, or from building the curve under different conditions from the scan.
| Mistake | What goes wrong | Fix |
|---|---|---|
| Setting the first or nearest hole to 80% instead of the highest | Other points can go above 100% FSH and saturate | Peak all holes first; set the highest response to 80% |
| Plotting a near-field point | The curve shape is wrong near the probe | Calculate N; start the curve beyond it |
| Changing gain, reject or filter between points | Points no longer share one reference | Freeze every amplitude setting after step 5 |
| Building on the first leg only | Second-leg indications are judged against an unmeasured curve | Measure both legs for angle beams |
| Block not matched to the part | Attenuation and velocity differ | Use a matched block or a measured transfer correction |
| Evaluating at scanning gain | Amplitudes read 6 dB or more too high | Return to the reference level (plus any transfer correction) |
| Skipping calibration checks | Drift goes unnoticed | Recheck at the procedure's interval; secondary sources report Article 4 voids data after a drop of more than 20% or 2 dB in a DAC point (confirm in your edition) |
Key takeaway: one DAC curve belongs to one probe, wedge, cable, instrument setting and scanning surface.
What are the limits of DAC curve evaluation?
A DAC curve compares amplitudes; it cannot tell a crack from slag, and it cannot size a reflector that is larger than the beam or tilted away from it.
- Orientation: a planar flaw tilted away from the beam can return less than 20% DAC and still be large. Lack of fusion on a bevel can give a weak echo at the wrong angle; more than one angle is the protection.
- Reflector shape: an SDH is a cylinder, a crack is a rough plane and porosity is a cluster of spheres. Equal % DAC does not mean equal size.
- Near-surface and far-end zones: the near field, the dead zone and the far end of the curve (where 20% DAC approaches the noise) all reduce reliability. See our guide to the dead zone in ultrasonic testing.
- Coarse-grain materials: austenitic welds and cast manganese steel scatter sound, so a carbon steel DAC doesn't apply.
- Curvature and coatings: transfer correction handles coupling losses, not changes in beam shape on curved parts.
- Operator dependence: peaking and point marking are manual, and FRA's 2026 study found calibration results varied widely between operators.
Key takeaway: % DAC is a screening and acceptance input, not a flaw size.
How EMA Industries applies this
EMA Industries provides NDT Level III services and ultrasonic examination from Southern California and mobilizes nationwide. A Level III review of a DAC procedure checks the block against the referencing code, near-field exclusion, both-leg coverage, transfer correction, recording levels and calibration checks. The same applies to AWS D1.1 structural weld UT, where the d rating replaces DAC, and to rail weld inspection. To review a procedure or schedule weld UT, contact EMA Industries.
Related reading: Angle beam testing in UT · Near field vs far field in UT · UT acceptance criteria standards · Shear wave ultrasonic testing
Frequently asked questions
How do you set up a DAC curve?
Verify the probe's index point, angle and range, then peak every usable reference hole beyond the near field. Set the highest response to 80% FSH, freeze the gain, and mark every other hole's peak at that gain on both legs. Join the points, add the 50% and 20% lines, and record the settings.
Why is the highest reflector set to 80% FSH and not 100%?
80% FSH leaves headroom so that a stronger indication can still be seen and measured without saturating the screen. ASME Article 4 practice uses 80% for the highest response; check your procedure for any tolerance on that value.
What does 50% DAC mean in dB?
It is 6.02 dB below the reference curve, because the amplitude is halved: 20 log₁₀(0.5) = −6.02 dB. 20% DAC is −13.98 dB, usually rounded to −14 dB.
What is the difference between DAC and TCG?
A DAC holds the gain fixed and draws a falling curve through the reference echoes. TCG increases gain with sound path so the same echoes all sit on a flat line, usually at 80% FSH. They carry the same calibration, but TCG keeps long-range indications readable above the noise.
Is a transfer correction always needed?
A transfer correction is needed only when the procedure calls for one, typically when the block differs from the part in surface finish, coating, curvature or attenuation. It is measured, for example by comparing a pitch-catch signal on the block and on the part, and added to the reference level. If the block is cut from the part, the correction is usually zero.
Sources
- DAC and TVG, Evident (Olympus IMS) flaw detection tutorial, accessed October 2026
- DGS/AVG, Evident flaw detection tutorial, accessed October 2026
- Beam characteristics (near field), Evident flaw detection tutorial
- AWS weld inspection tutorial (D1.1 indication rating), Evident
- AWS announces release of D1.1/D1.1M:2025, American Welding Society, April 17, 2025
- BPVC Section V, Nondestructive Examination, ASME, 2025 edition
- ASME basic calibration block, T-434.2.1, PH Tool product listing (block and hole dimensions)
- ISO 16811:2012, Ultrasonic testing: sensitivity and range setting, BSI listing (EN ISO 16811:2014)
- 49 CFR 213.237, Inspection of rail, eCFR; text checked on Cornell LII
- 49 CFR Part 213, 2025 annual edition (full text), govinfo
- DOT/FRA/ORD-26/07, model-assisted POD for handheld rail UT, FRA (ENSCO), July 2026
- ASNT Level II study guide: calibration blocks, DAC, TCG and sensitivity setting, open-exam-prep (secondary)